
A lot eCommerce brands spend hundreds of thousands of dollars on video ads without knowing which metrics give insights on how to improve those ads.
They check CTR, they check CPM, they check CPC, and then they decide whether a video is working based on ROAS. But they don’t know which metrics to measure in order to evaluate success AND help identity ways to improve results to drive more sales.
This post breaks down the most important metrics for measuring where your video ads are dropping off and where they have the most room to improve.
Meta ads are harder than they used to be.
A few years ago, you could run a basic product demo or a simple lifestyle video and get results. Today, your customers have seen thousands of ads. They're skeptical. They're scrolling fast. They're not waiting around for you to get to the point.
That means your video has to answer several questions almost immediately: Why should I stop scrolling? Is this for me? Do I care about this problem? Can this product actually help me? Is it worth clicking?
Video metrics help you figure out where your ad is winning, and where it's losing. A video might have a great hook but weak conversion intent. Another might have a lower hook rate but drive better purchases because it pulls in a more qualified buyer.
The goal isn't to use metrics as a vanity scorecard. The goal is to use them as creative intelligence.
Here's exactly how to do that.
Video Hook rate tells you what percentage of people who saw your ad watched the first few seconds.
This matters because the first battle in Meta ads is attention. Before someone can understand your offer or believe your promise, they have to stop scrolling.
A weak hook usually means one of three things: the opening visual wasn't interesting, the text hook was too generic, or the ad didn't create immediate relevance or curiosity.
A strong hook does at least one of these things: it calls out a specific customer, introduces a specific problem, creates curiosity, shows the product in an unexpected way, or uses the exact language your customer uses to describe their situation.
For example, a weak hook might say: "New protein formulas now available."
A stronger hook would say: "I've tried 50+ protein shakes. This one is different."
The second one works because it speaks to a real frustration. A great hook doesn't come from cleverness. It comes from real customer insights and experiences.
How to measure it: Hook rate is measured by dividing 3-second video views by impressions. For example, if your video was viewed 100,000 times with 35,000 impressions, then your hook rate is 35%. Hook rate is also a metric you can select inside the Meta Ad dashboard.
What good looks like: Aim for a hook rate of 25–40%+. Under 20% is a sign the opening needs some work. Over 40% means you've got something worth studying and scaling. If it’s below 20%, then you have room to improve your ad hook.

Once the video earns attention, the next question is: did people keep watching?
Average watch time tells you whether your message is strong enough to hold attention beyond the hook. A lot of ads can get people to stop. Fewer ads can keep them engaged.
If hook rate is strong but watch time is weak, the opening was interesting but the body of the ad didn't deliver.
This usually happens when the hook creates curiosity but the message becomes boring, the video takes too long to explain the product, or the ad talks about features without connecting them to outcomes.
There's a big difference between these two approaches:
"Moisture-wicking fabric." vs. "Stay cool, dry, and comfortable even when you're outside all day."
"Waxed cotton hats." vs. "The hat that breaks in the more you wear it."
Average watch time improves when customers feel like the ad understands their real-life experience.
How to measure it: In Meta Ads Manager, customize your columns to add "Video Average Play Time." This gives you the average number of seconds people watched across all views of that ad. Look at this at the ad level so you can compare individual creatives directly against each other. One thing to keep in mind: this metric includes people who watched for just one second, which can pull the average down. So look at it alongside your retention curve and completion rates to get the full picture. A single number in isolation won't tell you much, but combined with those other metrics, average watch time becomes a reliable signal of whether your message is actually landing.
What good looks like: For a 30–60 second ad, aim for an average watch time of at least 15 seconds. For shorter ads (under 15 seconds), you want people watching 50%+ of the video. The higher the better since watch time is a proxy for message quality.
Average watch time tells you how long people watched. The retention curve tells you where they left.
This is one of the most useful diagnostic tools in video creative.
If people drop off in the first few seconds, the hook is weak. If they drop off after the hook, the transition may be the problem. If they drop off during the product explanation, the messaging is probably too feature-heavy. If they drop off before the CTA, the ad isn't building enough desire.
Use the retention curve as an editing tool. You're looking for friction. Where does the ad lose momentum? Where does the message get unclear?
Great video ads maintain emotional continuity. They move from:
Problem → Emotion → Product → Proof → Outcome → CTA
When that sequence is clear, retention improves. When the ad jumps around, people leave.
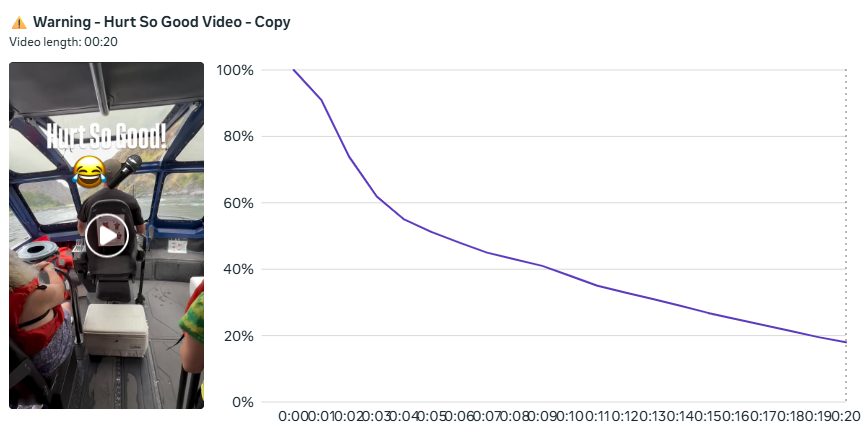
How to measure it: In Meta Ads Manager, go to your ad level, click into the video and look for the retention curve under video insights. It shows you a second-by-second graph of how many viewers were still watching at each point in the video. Pay attention to the shape of the curve, not just the average.
What good looks like: A healthy retention curve stays relatively flat through the first half, then drops gradually toward the end. That's normal viewer behavior. What you don't want to see is a sharp cliff in the first 3–5 seconds (hook problem), a sudden drop right after the hook (weak transition), or a steep fall during the product explanation (messaging is too feature-heavy or the pacing is too slow).
Meta gives you play metrics at different completion points, and each one tells you something different.
25% views tell you whether the opening concept created initial interest. 50% views tell you whether the body of the message stayed relevant. 75% views suggest deeper engagement. 95% views mean the video held attention almost all the way through.
But these numbers need context. A 95% completion rate on a six-second video is very different from a 95% completion rate on a forty-five-second video.
Also: don't treat completion as the ultimate goal. A high completion rate is only valuable if the ad also creates action. A video people watch all the way through but never click on or buy from isn't doing its job.
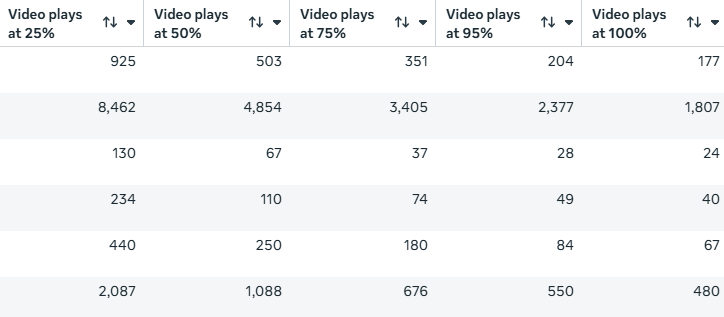
How to measure it: In Meta Ads Manager, go to the ad level and add the video play columns, specifically 25%, 50%, 75%, and 95% video plays. You can customize your columns to show these alongside your other key metrics. Look at each completion stage as a percentage of total impressions to see how far into the video people are actually getting.
What good looks like: A great video ad will have 30%+ watch 25% of the video, 20%+ watch 50%, 15%+ watch 75%, 10%+ watch 95%. The numbers will naturally drop at each stage, that's expected, and metrics for different types of videos and industries will be different. What you're watching for is where the drop is steeper than it should be, because that's where the message is losing people.
Outbound click-through rate tells you how many people clicked from your ad to your website.
This is where attention starts becoming intent.
A video can get strong watch time but still fail to drive clicks. That usually means the offer wasn't compelling, the product value wasn't clear, the CTA was weak, or the audience was entertained but not motivated.
Here's how to think about it: hook rate tells you if people stopped. Watch time tells you if people stayed. CTR tells you if people cared enough to act.
A strong video ad creates a natural next step. The viewer thinks: I need this. I want to see this. This might solve my problem. I want to check the price.
If that's not happening, the video may be interesting, but it's not persuasive enough.
People don't click because a product has features. They click because the ad makes the product feel relevant to their life.
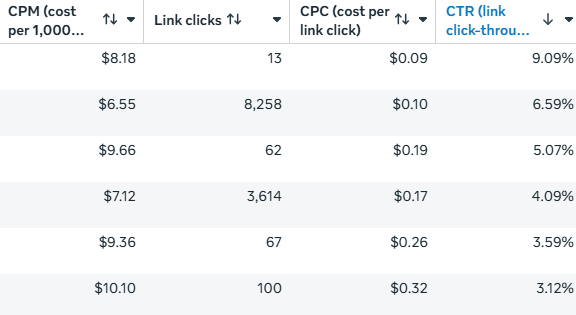
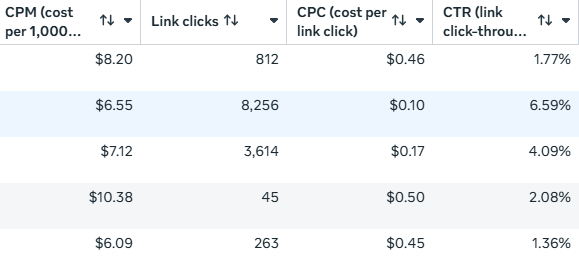
How to measure it: In Meta Ads Manager, make sure you're looking at outbound CTR, not link CTR. Link CTR includes clicks to your Facebook page, profile clicks, and other on-platform interactions that never send anyone to your website. Outbound CTR only counts clicks that actually leave Meta and land on your site. To find it, customize your columns and add "Outbound Clicks" and "Outbound CTR." That's the number that matters.
What good looks like: A solid outbound CTR for eCommerce video ads is 1–2%. Above 2% is strong. Above 3% is excellent. Under 0.5% usually means the ad isn't creating enough motivation to act.
Cost per click tells you how much you're paying to get someone from Meta to your website.
A high CPC can signal that the creative isn't resonating, the audience isn't responding, or the offer isn't strong enough. A lower CPC often means the ad is earning more efficient engagement.
But here's the catch: cheap clicks aren't always good clicks.
An ad can generate low-cost traffic and still fail to produce purchases. Some ads are curiosity-heavy but buyer-light. They get clicks, but those clicks don't turn into revenue.
That's why you have to look at CPC alongside conversion rate, CPA, and ROAS. The question isn't "are we getting cheap clicks?" The question is "are we paying a reasonable amount to get the right people to the site?"
How to measure it: In Meta Ads Manager, customize your columns to add "CPC (Cost Per Link Click),” but make sure you're using the outbound version, not the all-clicks version. All-clicks CPC includes on-platform interactions that never visit your site and will make your CPC look artificially low. You want to know what you're actually paying per website visit. Track this at the ad level so you can compare creative directly against each other rather than looking at blended numbers across a whole campaign.
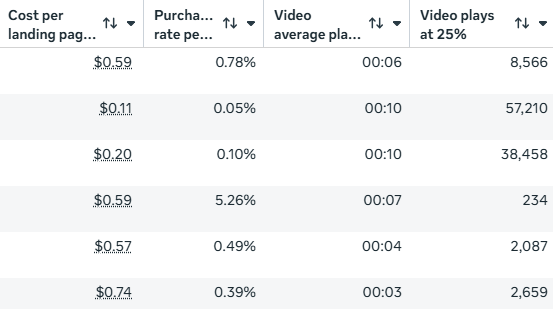
What good looks like: Average eCommerce CPC on Meta runs $0.50–$2.00+, but this varies widely by niche, audience, and competition. More important than hitting a specific number is seeing CPC trend down as you improve creative, while also making sure those clicks are converting and line up with your profitability goals.
Video metrics don't stop inside Meta.
One of the biggest mistakes brands make is analyzing ad performance without looking at what happens after the click. If an ad gets clicks but the website doesn't convert, something is broken.
Sometimes the problem is the website. Sometimes it's the ad. But often it's the disconnect between the two.
This is where message match matters. If the ad promises one thing but the landing page says something else, conversion rate suffers. If the ad attracts bargain hunters but the product is premium, conversion rate suffers. If the ad focuses on an emotional problem but the landing page only lists features, conversion rate suffers.
For example, if the ad says "waterproof hats built for long days on the water," the landing page should immediately reinforce waterproof performance, outdoor durability, comfort, and customer proof. If it opens with vague lifestyle branding instead, you'll lose the momentum the ad created.
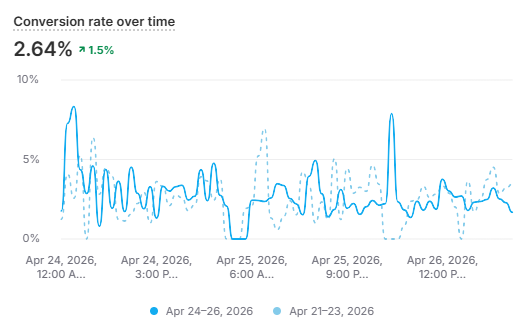
How to measure it: Meta Ads Manager won't show you this directly which means you need to pull it from your Shopify analytics or wherever you track site performance. Take the number of orders generated from your Meta traffic and divide it by the number of sessions Meta sent to your site. If you're using UTM parameters on your ad URLs, you can filter this cleanly in Google Analytics. For a more granular view, look at conversion rate by landing page URL so you can see which specific pages are converting traffic and which ones are leaking.
What good looks like: eCommerce conversion rates typically run 2–3%. Above 3% is strong. Under 1.5% usually means there's a message match problem or the landing page experience needs significant work unless the product is very expensive or there is some other type of conversion rate issue going on.
At the end of the day, cost per acquisition is the metric that matters most.
CPA tells you how much it costs to acquire a customer. This is where creative performance meets business reality.
An ad with a great hook rate but a poor CPA is not a winner. An ad with lots of engagement but a poor CPA is not a winner. An ad with beautiful production but a poor CPA is not a winner.
For eCommerce brands, CPA has to be evaluated against average order value, gross margin, repeat purchase rate, and customer lifetime value. Some brands can afford a higher CPA because they have strong repeat purchase behavior. Others need a lower CPA because they sell one-time purchases or have tight margins.
That's why there's no universal CPA benchmark. A good CPA for one brand is unprofitable for another, which is why you need to know your own unit economics.
How to measure it: In Meta Ads Manager, add "Cost Per Result" to your columns, but make sure your campaign objective and conversion event are set correctly first. If you're optimizing for purchases, this will show you your cost per purchase. Look at this at the ad level so you can compare individual creatives against each other.
What good looks like: A profitable CPA is one that falls within your target customer acquisition cost based on your margins and LTV. A general rule of thumb: if CPA is under 30–40% of AOV on a one-time purchase brand, you're likely in good shape. But the real benchmark is your own numbers, not an industry average.

ROAS matters the most, but it also has to be interpreted correctly.
ROAS tells you how much revenue is attributed to your ad spend inside Meta. MER, i.e. marketing efficiency ratio, tells you how your total revenue compares to your total marketing spend.
For eCommerce brands, MER is often a better high-level metric because platform attribution is imperfect. Meta may underreport. Meta may overreport. Customers may see multiple ads before buying. Email and SMS may capture demand that paid social created. Google may capture branded search that Meta drove.
That's why the best brands look at both platform metrics and business-level metrics together. Inside Meta, you care about hook rate, watch time, CTR, CPC, CPA, and ROAS. At the business level, you care about MER, new customer acquisition, contribution margin, and blended CAC.
Meta isn't just a direct-response machine. It's also a demand creation engine. A video's impact can show up beyond the immediate click.
How to measure it: For ROAS, Meta Ads Manager calculates this automatically. Go to your dashboard and add "Purchase ROAS" to your columns, and it will show you the return on ad spend Meta is attributing to each ad. For MER, you won't find this inside Meta and need to calculate it yourself by taking your total revenue for a given period and dividing it by your total marketing spend across all channels. Do this weekly or monthly and track it over time. MER is a blunt instrument but an honest one. It tells you whether the overall marketing system is working regardless of what any individual platform is claiming credit for. If Meta ROAS looks strong but MER is declining, that's a signal worth investigating.
What good looks like: A target ROAS of 2–3x is common for eCommerce brands, although this depends heavily on margins. For MER, most healthy eCommerce brands aim for 3–5x, but more important than hitting a specific ROAS is understanding how paid social is affecting total revenue growth and new customer acquisition.

Keep in mind, a video can get thousands of likes and still fail to sell. A video can get lots of comments and still attract the wrong audience. A video can have a high view count and still produce poor-quality traffic.
The goal isn't popularity or views. The goal is profitable and predictable revenue.
That doesn't mean engagement is useless. Engagement can be a signal. But it's not the final answer. The question is whether engagement is connected to buying intent. Are people commenting because they want the product? Are they saving the ad because they're considering a purchase? Or are they just reacting to entertaining content?
There's a big difference.
Great eCommerce creative doesn't just entertain. It sells.
When reviewing a video ad, think in three stages.
Stage 1: Did it stop the scroll? Look at hook rate and 3-second views. If the video doesn't stop the scroll, you need a stronger opening, i.e. a better text hook, a more interesting first frame, or a sharper problem statement.
Stage 2: Did it hold attention? Look at average watch time, the retention curve, and completion rates. If people stop watching too early, improve the story, pacing, or emotional relevance of the body.
Stage 3: Did it drive action? Look at outbound CTR, CPC, conversion rate, CPA, and ROAS. If people watch but don't click or buy, the ad may need a stronger offer, clearer product value, better proof, sharper CTA, or tighter message match with the landing page.
No single metric tells the whole story. The real insight comes from measuring, studying, and analyzing the metrics together.
Here's the thing most brands miss: your video metrics are downstream of your customer insights.
If you don't understand your customer, your hooks will be generic. If your hooks are generic, your hook rate will suffer. If your message is generic, your watch time will suffer. If your value proposition is unclear, your CTR will suffer. If your ad attracts the wrong people, your conversion rate will suffer.
That's why the best ads often come directly from customer language. Reviews, testimonials, support tickets, survey responses, etc. That's where the gold is.
This is exactly what we do with the Conversion Engine Brand DNA Performance System. Instead of guessing what will resonate or copying what other brands are doing, we build ads based on real customer insights, i.e. the exact language, frustrations, desires, and buying triggers your customers use when they talk about products like yours. That foundation is what makes the metrics really move.
The brands that win on Meta aren't the ones that create one good ad. They're the ones that build a creative feedback loop.
They research. They create. They launch. They measure. They learn. They iterate. They scale what works. They improve what almost worked. They replace what failed.
That's the key to sustainable performance on Meta.
Great ads don't happen by accident. They're built from real customer insights, shaped by emotional buying triggers, tested through clear creative hypotheses, and measured against strategic business outcomes.
When you combine the right metrics with the right customer research, you stop guessing what will work and start building a system for scalable growth.
Ready to see how this works for your brand?
Schedule a Brand DNA Performance Analysis and we'll show you exactly how to use our system to improve these metrics and scale your Meta ads profitably. Book your analysis here.

Scaling Fast-Growing eCommerce Brands with Profitable & Predictable Growth Strategies | Paid Media & Retention Expert | DM to Discuss Your Growth Potential
